


Kathryn Statham
The ECHO features of aortic stenosis can be explained through the natural history and the pathophysiology of the disease.
Degenerative calcific AS is a progressive valvular disease. It is characterised by
- A long latent period when the patient is asymptomatic despite progressive obstruction of the valve
- Once symptoms occur, there is a rapid decline in survival
- Once development of angina occurs patients have a 5 year survival, of syncope a 3 year survival and of heart failure a 2 year survival
- The natural history of valve replacement (TAVI) has significantly altered survival


During the latent period there is increased afterload causing progressive increased LV overload causing increasing filling pressures and left ventricular hypertrophy

ECHO features to look for in AS include
- Heavily calcified aortic valve or visible leaflet restriction
- Left ventricular hypertrophy
- Concurrent aortic regurgitation (due to stiff and immobile valve)
- Diastolic dysfunction
- +/- dilatation of the aorta as an abnormal geometry or size of the aorta may indicate the presence of a bicuspid valve
- LA dilatation
- Pulmonary Hypertension (2 to increased afterload and significant diastolic dysfunction/ elevation of filling pressures )
Assessment of Severity
An integrative approach is used to assess AS using 2D and quantitative assessments along with the clinical presentation of the patient. We will be discussing the 2D assessments in this post
2 D Assessment
- Presence & degree of LVH – LVH increases with degree of stenosis
- Planimetry of the valve – tracing the inner area of the valve from the PSAX in systole
- Aortic cusp separation (M-mode)
- Presence of flow turbulence
1. Degree and presence of LVH
Measurement of IVS and posterior wall of the LV in the PLAX, using calipers or M mode ( if correctly aligned )
M mode in PLAX view


Caliper measurements in PLAX view


2. Planimetry of the valve- tracing the inner area of the valve from the PSAX view
This is performed in the PSAX. The aortic valve is visualised and the area traced directly. This is possible is approximately 75% of patients using TTE, but studies have shown that this can be an accurate method of measuring the valve orifice
 2.
2. 
Figure 1 Valve area 3.62 cm, Figure 2 Valve area 0.48 cm
3. Aortic cusp separation (ACS) using M mode
This can be done from the PLAX view by placing an M mode beam through the aortic valve leaflets or from the PSAX view
PLAX view: ACS 0.6 cm


PSAX view : ACS 0.6 cm


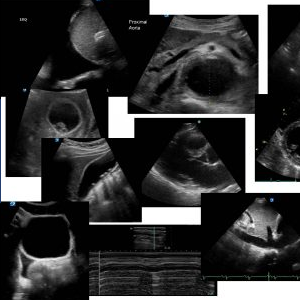
4. Presence of flow turbulence
The presence of turbulence in the Av valve and the proximal aorta is a feature of aortic stenosis
References
- Echocardiographic predictors of pulmonary hypertension in patients with severe aortic stenosis Nikhil Kapoor, Padmini Varadarajan, Ramdas G. Pai
European Journal of Echocardiography, Volume 9, Issue 1, January 2008, Pages 31–33, https://doi.org/10.1016/j.euje.2007.01.005