


Images and Text Genevieve Carbonatto
If we consider that there are different levels of expertise in the acquisition of knowledge of echocardiography for the Critical Care Physician, the recognition of acute cor pulmonale which we see with submassive pulmonary embolus has been described as a Level II skill, level I being the minimal level of knowledge required for critical care physicians.

The 2009 American College of Chest Physicians Consensus Statement defining critical care ultrasound considered the diagnosis of acute cor pulmonale a basic CCE (critical care ECHO) skill. The consequences of a missed diagnosis of a massive PE in the Emergency Department is devastating.
Case history : A 56-year-old man presents to the ED with a history of syncope followed by SOB (shortness of breath). The differentials include PE and aortic dissection.
What are the cardinal ECHO features of a significant pulmonary embolism?
- Acute RV dilatation
- Paradoxical flattening of the IVS – D shaped ventricle
- Pulmonary Artery Pressures (PAP’s) of less than 60 mmHg if the heart is normal
What other features may be present ?
- +ve MConnell’s sign
- 60/60 sign
- presence of a DVT
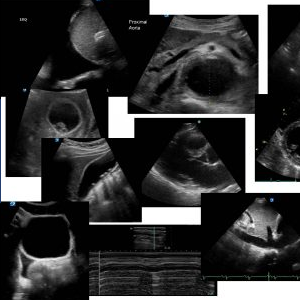
Large RV (compare with LV)
Flattening of IVS causing a D shaped ventricle
RV large. MConnell’s sign. MConnell’s sign is due to right mid free wall hypokinesis and preserved right ventricular apical contraction. This causes localised systolic indentation at the apex of the right ventricle where the junction between preserved systolic function and reduced systolic function occurs.


Large RV, small LV cavity


Flattening of the IVS – D shaped ventricle


RV dilatation. The RV should be 2/3 of the size of the LV. Here it is the same size if not bigger than the LV.
Discussion
How can we assess RV dilatation?
When can we consider the RV to be abnormal? We can compare the end diastolic area of the RV with that of the end diastolic area of the LV.
RV/LV EDD (end diastolic dimension) ratio of >0.7 has been found to be the most accurate predictor of acute pulmonary embolism (5).It is sensitive but not specific (sensitivity 66%, specificity 77%) for a large or submassive PE.
What is MConnell’s sign (6) ?
Patients with primary pulmonary hypertension have abnormal RV function in all regions. Patients with RV dysfunction from acute PE or from RV infarction may have a regional wall abnormality. The RV mid ventricular free wall is hypokinetic while the apical wall has preserved function. MConnell’s sign has a sensitivity of 70% and a specificity of 33% in the context of acute pulmonary hypertension. (6) If seen it should not be considered diagnostic of a PE but contribute to the overall ECHO findings in diagnosing a submassive PE.
What is 60/60 sign?
This refers to a RV systolic pressure (RVSP) of less than 60 mmHg and a pulmonary acceleration time (PAT) of less than 60 msec. (8) This has been found to be 94% specific and 36% sensitive in diagnosing PE. High RV pressures (>60mmHg) can only be generated in the context of chronic pulmonary hypertension. In the context of acute pulmonary hypertension pressures, because the RV wall has not had time to hypertrophy, high RV pressures cannot be generated.

How do you calculate the RVSP?
RVSP = Tricuspid gradient + RAP (right atrial pressure)
The Tricuspid gradient is measured by first using colour to identify the tricuspid regurgitant jet and then putting a CW (continuous wave) Doppler line across the tricuspid valve and measuring the peak velocity of the tricuspid regurgitant jet. To be as accurate as possible, the CW Doppler line should be aligned as perfectly as possible with the colour jet. Using the modified Bernoulli equation, Δ P = 4 V², the pressure across the tricuspid valve is measured by the machine. This gives you the systolic gradient between the right ventricle and the right atrium. You then need to add the RAP (right atrial pressure) to get the (RVSP) right ventricular systolic pressure . The RAP is estimated by looking at the IVC size and collapsibility.
In the case above, the tricuspid gradient was 31mmHg.

Note that the tricuspid gradient should be taken where the tricuspid regurgitant jet is most in line with the CW Doppler line. There are 3 points where it could be measured. From the parasternal long inflow jet signal, from the parasternal short axis inflow jet signal or from the apical view.

The IVC was 1.87 cm and collapsing less than 50%, which would correspond to an added RAP of 8mmHg to get to the RVSP . The RVSP is 31mmHg + 8mmHg = 40mmHg . It is therefore less than 60mmHg.
How do you measure the Pulmonary acceleration time?
By putting a PW (pulse wave) Doppler through the PV (pulmonary valve) the acceleration time is 35 msec (normal >130 msec). This is achieved by obtaining a classical parasternal short axis view of the aorta and tilting up a little. The PV and the pulmonary arteries will come into view. The PW Doppler sample volume is placed at the level of the pulmonary valve rather than the RVOT as it is rare to be able to align the Doppler beam parallel to the flow if placed in the RVOT. The measurement is taken from the beginning of the blood flow to the peak. PAT < 60 msec suggests severe pulmonary hypertension as the velocity and pressure peak very quickly. They peak quickly because there is an obstruction or impedance to flow in the pulmonary arteries. With no obstruction, the acceleration time would be longer as the flow through the pulmonary arteries would be unhindered.

In this case the pulmonary acceleration time is 35 msec. We therefore have a positive 60/60 sign. Both the RVSP (right ventricular systolic pressure)and the PAT (pulmonary acceleration time) are less than 60
If you look at the Doppler trace , here is also a mid systolic notch which also indicates elevated pulmonary artery pressures. RV outflow occurs in systole, but with RV outflow obstruction, the pressures in the pulmonary arteries exceeds the RV outflow pressures temporarily causing the PV to partially close. The RV outflow then overcomes these pressures and the PV opens fully again. This opening and partial closing and then reopening of the PV causes this notch to appear.
DVT
The easiest corroborative finding in the context of a possible PE is to look for a DVT. Vein compression of the CFV (common femoral vein), FV (femoral vein) and PV (popliteal vein) can easily be done in the emergency department. Non compressibility of a vein indicates a thrombus. Studies have shown that about 70% of patients with PE have proximal DVT’s (9)
Here the popliteal vein is non compressible. The PV lies superficial to the PA (popliteal artery). It is possible to compress the artery but not the vein
Teaching point: Recognition of RV dilatation, a D shaped LV and MConnell’s sign should be core ECHO skills. The addition of the 60/60 sign is helpful in differentiating acute from chronic pulmonary hypertension.
References
- American College of Chest Physicians/La Société de Réanimation de Langue Française statement on competence in critical care ultrasonography. Chest 2009 Apr;135(4):1050-1060. doi: 10.1378/chest.08-2305. Epub 2009 Feb 2.
- Consensus on circulatory shock and hemodynamic monitoring. Task force of the European Society of Intensive Care Medicine
Maurizio Cecconi,corresponding author Daniel De Backer, Massimo Antonelli, Richard Beale, Jan Bakker, Christoph Hofer, Roman Jaeschke, Alexandre Mebazaa, Michael R. Pinsky, Jean Louis Teboul, Jean Louis Vincent, and Andrew Rhodes , Intensive Care Medicine 2014; 40(12): 1795–1815. - http://ultrasonographie-vasculaire.edu.umontpellier.fr/files/2013/12/CR-CPA-et-ETT.pdf , file:/
- https://com-anest.sites.medinfo.ufl.edu/files/2015/06/ACCPGuidelines.pdf
- Echocardiographic predictors of pulmonary embolism in patients referred for helical CT.
Lodato JA1, Ward RP, Lang RM. Echocardiography 2008 Jul;25(6):584-90. - Regional right ventricular dysfunction detected by echocardiography in acute pulmonary embolism. McConnell MV Amer J Cardiol 1996 Aug 15;78(4):469-73
- Casazza F, Bongarzoni A, Capozi A, Agostoni O. Regional right ventricular dysfunction in acute pulmonary embolism and right ventricular infarction. Eur J Echocardiogr. 2005;6(1):11-4
- Disturbed right ventricular ejection pattern as a new Doppler echocardiographic sign of acute pulmonary embolism. Kurzyna M1, Amer. J. Cardiol. 2002 Sep 1;90(5):507-11.
- Circulation. 2003;107:I-22-I-30 natural history of Venous thromboembolism